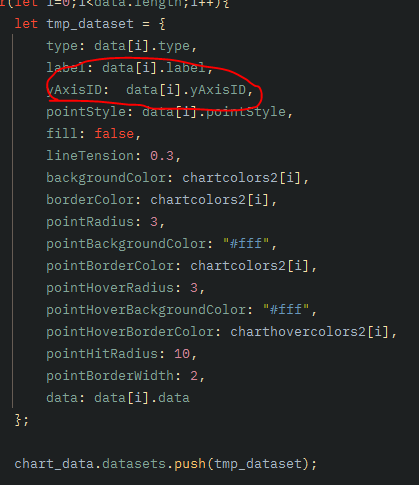
1. chartjs 데이터 label 외에 yAxisID를 추가해준다.
Y축 ID없이 그냥 position을 바꾸면1. chartjs 데이터 label 외에 yAxisID를 추가해준다.
아니면 dataset에서 설정해주던가..
Y축 ID없이 그냥 position을 바꾸면 값만 생기고 차트는 오른쪽값을 따라서 그려지게 된다.

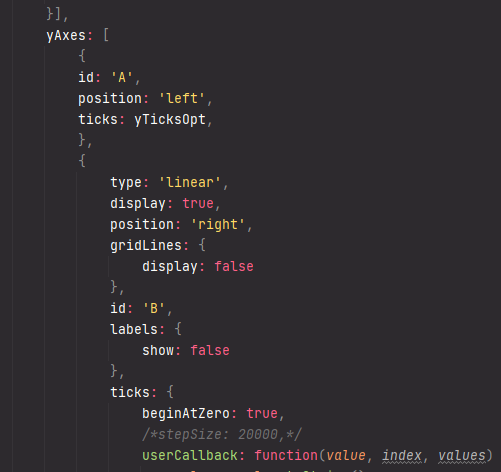
2. options 의 scale에서 설정해준다.
[ options > scales > yAxes ]
position을 바꿔주면 된다.
참고코드 : embed.plnkr.co/dtb9tl/
<!DOCTYPE html>
<html>

  <head>
    <link rel="stylesheet" href="style.css">
    <script src="https://cdnjs.cloudflare.com/ajax/libs/Chart.js/2.7.1/Chart.min.js"></script>
    <script src="https://cdnjs.cloudflare.com/ajax/libs/Chart.js/2.7.1/Chart.bundle.min.js"></script>
  </head>

  <body>
    <h1>Hello Plunker!</h1>
    <div style="width:100%;">
      <canvas id="chart"></canvas>
    </div>
    <script src="script.js"></script>
  </body>

</html>
// Code goes here
var ctx = document.getElementById('chart').getContext('2d');
new Chart(ctx, {
type: 'line',
data: {
labels: ['Visit 1', 'Visit 2', 'Visit 3', 'Visit 4', 'Visit 5'],
datasets: [{
label: 'LVEF % (Echo)',
yAxisID: 'A',
borderColor: '#ffbaa2',
backgroundColor: 'white',
data: [80, 70, 30, 20, 35],
fill: false
}, {
label: 'Rhythm',
yAxisID: 'B',
borderColor: '#91cf96',
backgroundColor: 'white',
data: [80, 76, 79, 82, 80],
fill: false
}, {
label: 'Height',
yAxisID: 'C',
borderColor: '#c881d2',
backgroundColor: 'white',
data: [185, 184, 183, 184, 185],
fill: false
}, {
label: 'Weight',
yAxisID: 'D',
borderColor: '#29b6f6',
backgroundColor: 'white',
data: [65, 65, 65, 65, 65],
fill: false
}]
},
options: {
tooltips: {
mode: 'nearest'
},
scales: {
yAxes: [{
id: 'A',
type: 'linear',
position: 'left',
ticks: {
min: 0,
max: 100,
stepSize: 20,
fontColor: '#ffbaa2',
callback: function(value, index, values) {
return value + ' %';
}
}
}, {
id: 'B',
type: 'linear',
position: 'right',
ticks: {
min: 60,
max: 140,
stepSize: 16,
fontColor: '#91cf96',
callback: function(value, index, values) {
return value + ' bpm';
}
}
}, {
id: 'C',
type: 'linear',
position: 'right',
ticks: {
min: 160,
max: 190,
stepSize: 6,
fontColor: '#c881d2',
callback: function(value, index, values) {
return value + ' cm';
}
}
}, {
id: 'D',
type: 'linear',
position: 'right',
ticks: {
min: 50,
max: 100,
stepSize: 10,
fontColor: '#29b6f6',
callback: function(value, index, values) {
return value + ' kg';
}
},
scaleLabel: {
display: false
},
}]
},
elements: {
line: {
tension: 0, // disables bezier curves
},
point: {
radius: 4,
borderWidth: 2,
pointStyle: 'circle'
}
}
}
});
'memo' 카테고리의 다른 글
| [chartjs] 한 개의 툴팁 자동 팝업 & 클릭시 팝업 (0) | 2021.04.19 |
|---|---|
| [자바 / JAVA] 세자리 수마다 콤마 찍기 (0) | 2021.04.13 |
| 인텔리제이 단축키 (0) | 2021.04.12 |
| [chartjs] 그리기 순서 변경 하기, Z-index, legend 순서 변경 (0) | 2021.04.09 |
| [chartjs] 차트js 그래프 크기 설정 / 조절하기 (0) | 2021.04.06 |
| key value (0) | 2021.03.24 |
| [리액트] is unrecognized in this browser. If you meant to render a React component, start its name with an uppercase letter. 에러 (0) | 2021.03.17 |